After measuring the performance of hundreds of Healthcare Systems, Healthcare Performance Systems came to the same conclusion that Google did measuring 1 big organization (themselves). Google called it PROJECT OXYGEN — they couldn’t survive without it. They and we both found the single most important vital factor in an organization’s success and to an employee’s performance is . . . Leadership.
The best way to make employees more effective, improve operating margins and create incredible customer/patient outcomes is improve leadership effectiveness.
And the best way to improve leadership effectiveness is to align leadership talent with the demands of each position. Doing this requires that business leaders have sophisticated performance measurement tools to more easily differentiate and interpret information.
The Visual Display of Quantitative Information
Introduction to the Eye Chart Suite of Tools
Business leaders don’t relate well to and are not motivated by statistical coefficients and academic correlations. They need practical and applied causal links and measures of performance that they can readily see and relate to logically and emotionally. Do the measurement tools need to be scientifically valid and reliable? Absolutely. Should the data be presented in a way that is less effective, often confusing, overloaded with information, and difficult to interpret? No. That is where Eye Charts come in. Eye Charts are a unique way of displaying large amounts of data about the leadership ability of every leader in a company, from front‐line managers to senior executives, in a way that is readily understood. It provides business intelligence and actionable knowledge in a readily accessible visual format. Eye Charts are sophisticated performance measurement tools that provide a visual display of quantitative information, making it easier for leaders to quickly understand what is happening in their companies and to make better business decisions. The format makes it simple to do an instant analysis of an individual manager or a comparative analysis of managers within a leader’s total span of responsibility or control.
The Talent Management Eye Chart ( For more information and a picture of the Talent Management Eye Charts, see the RPR2 white papers Using the Talent Management Eye Chart and Talking Points for Reviewing Talent Management Eye Chart Results.)
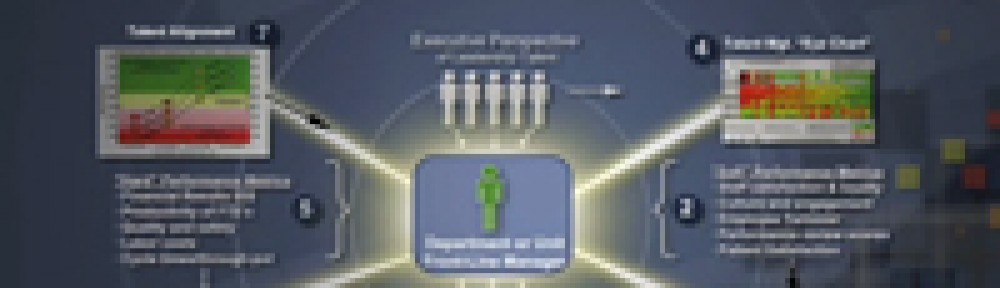
The Talent Management Eye Chart (TMEC) is a top‐down multi‐rater assessment of the demonstrated leadership ability represented by every leader within the organization. This display provides a large‐scale visual comparison across departments based on executive, director, and front‐line manager leadership talent. With the TMEC, executives can instantly observe which managers may be over-leveraged and which leaders are under-leveraged. Departments are listed across the top.
Of all the five senses, our brain is designed to best process information visually, rather than as words or numbers. Looking through a large numerical table or spreadsheet takes a lot of mental effort, but information presented visually can be grasped in a few seconds; the “uptake” or “get it” factor is instantaneous, which is why people respond emotionally to art. The brain identifies patterns, proportions, and relationships to make instant subliminal comparisons. The right hemisphere of the brain recognizes shapes and colors. The left hemisphere processes information in an analytical and sequential way and is more active when people read text or look at a spreadsheet. The Eye Charts allow for both left‐ and right‐brain interpretation of information and relative performance in a single view. Displaying information in this format can make a significant difference by enabling people to understand complex matters quickly and to consider more creative solutions.
Another feature of the Eye Chart tools is their affordability and ease of use. There is no proprietary software to purchase because all the tools and data are integrated and aligned within Microsoft Excel, and the entire suite of tools connects instantly.
The top section quantifies to seven proven attributes of leadership ability. The middle section evaluates the qualifications of the department’s leaders. The bottom section evaluates the complexity, barriers, and obstacles in managing the department (the department’s Degree of Difficulty). All ratings are color‐coded to provide instant visual information on the status of each department. At one end of the spectrum, in the reds, we can instantly observe which managers may be over-leveraged (or in over their heads) and need help. At the other end of the chart, in greens, we can view which leaders are under-leveraged and have the ability to manage increased responsibility, in greens. This makes it easy to see which leaders are struggling and which are excelling, and makes it easier for executives to manage their talent.
Four Distinct Leadership Alignment and Coaching Zones
If in alignment – GREEN Zone (with good odds of success) and Succeeding or Excelling
This leader is most likely properly aligned and is achieving the expected performance targets.
If in alignment – GREEN Zone (with good odds of success) and Struggling or Failing
The leader should be successful in this role, so consider what obstacles and barriers could be impeding performance. Also consider the timetable required for a “turnaround” within the span of control or leadership style/behaviors.
If out of alignment (in over their heads with lower odds of success) and Succeeding or Excelling
This leader is performing well in spite of having odds that may be lower than 50%/50%. (Remember that while this is possible, it is not often likely). Although this leader/manager is doing well, you must be careful not to add too much complexity to their assignment because they are vulnerable to becoming overleveraged. Keep them in their role, coach them appropriately, and avoid adding to their span of control or complexity.
If out of alignment (in over their heads with lower odds of success) and Struggling or Failing
This leader may be challenged with obstacles or barriers, the complexity of the assignment, their leadership ability level, talent, or experience, and/or their leadership style and may not be suitable for the assignment.
Refer to the 5‐Level process below to more accurately diagnose the factors that could be causing sub-optimized performance. Also, consider the following additional questions:
- Were they genuinely ready for the assignment? What is their percentile ranking?
- How long has the person been in the role?
- Are there any leadership attributes that are taking away from their effectiveness?
- If recently appointed, was the assignment “a turnaround” project? If yes, provide more time and resources needed to overcome the challenges.
- If in the role for a “tenured” period of time (2 years or longer), consider whether the person will be successful in turning around their performance in a reasonable period of time.
For more information on using the Talent Management Eye Charts, see the RPR2 white papers Using the Talent Management Eye Chart and Talking Points for Reviewing Talent Management Eye Chart Results.