 The NCAA Tournament, March Madness, Upsets and the Cinderella Story. Looking for ways to make the Madness more exciting? How about the secret to making your picks and your bracket better than the rest. Success Profiles has created the March Madness Eye Chart, a comprehensive comparison of all 68 teams that made the dance. Our large-scale visual tool gives you a side by side comparison of the most important categories of offense, defense and overall strength. Click here for the full Eye Chart and to put the Odds of Success in your favor.
Succession Planning – Is your organization ready for the impact? Join Success Profiles and Healthcare Performance Solutions for a free Webinar on the “Succession Planning” There will be two times to conveniently meet your scheduling needs. Click on the links below to sign up and join us to learn how you we can take your organization to the next level.
Tuesday Mar 27th – 12:00 -12:45pm (EST)
Click Here to Register
Tuesday Mar 29th – 2:00 – 2:45pm (EST)
Click Here to Register
GEAR DOWN, NOT SHUT DOWN
To climb tough hills, you have to gear down, not shut down.
Structured talent management is a wise investment, especially in economic turmoil. Nobody ever got to the top of a mountain by stopping when it started to get steep. And nobody ever got any better at doing their job by halting their efforts to improve. But it is wise to slow down a bit in both cases and think about how to solve your problems in the most efficient way. Mountain climbers think about energy. Healthcare organizations think about people, time, and money. One way is to leverage the in-house talent you already have. Your in-house talent can pull you through tough times if you have put the Right People in the Right Roles in a disciplined system that maximizes your Odds of Success.
After all, most people want to invest wisely in their own people, but how do you know what is wise? There are 2 ways. The first way is to guess . . . I mean use your gut instinct. The second way is to measure, benchmark, evaluate, review, and reiterate. It is possible to get success both ways, but is it just as likely to get success both ways? The margin of performance gained through disciplined business practices is extremely valuable to your bottom-line. How valuable? Well, it is not priceless. How much should you spend on this ability? How about MUCH LESS!
Especially in tough times, securing the benefit of a superior approach while spending less money doing so is smart business. Smart business decisions allow you to provide first-class healthcare to more people, and in the Healthcare business, that is success.
A relentless determination to improve and eliminate waste through mistakes is at the heart of continuous improvement concepts, such as lean manufacturing. This revolutionized the manufacturing industry, completely changing customer expectations of performance and service. Healthcare is far from immune to these changes. The new mindset affects both patients and providers alike. High performing leaders and organizations remain constructively dissatisfied at existing standards. Testing solutions your organization uses against new ways that arise, allows you to either validate your existing techniques or discover an improved way. The improvements can come through speed, reliability, performance or price.
Excerpts from “A Discussion with Jon Cecil, CHRO at Lee Memorial Health System: How We Successfully Navigated Our Recent Financial Turnaround”
“Understanding the challenges, the senior leadership team worked to accelerate the change in our organization’s internal culture. Over the last few years, we had prided ourselves on our cost and waste reductions and quality improvements through many initiatives, including our Productivity Committee and Lean/Sigma team. It became shockingly obvious this pace of change was not enough. At first we were in denial about our reversing market, the accuracy of our volume trends, and our management operating data validity. We initially disagreed as a team. It prevented us from decisive action, and we lost valuable time in making the level of improvements we need to make.”
Tip #1: The data doesn’t lie. Avoid getting mired in the minutia, validate your data, and quickly react to trends as they are occurring. Senior leaders must pull together and stay focused on fixing your financial situation, or you will not be able to achieve your other strategic goals. Reach consensus quickly with senior leaders and be sure that all levels of leadership are on the same page with you on what the game plan will be. The further the leader was from the top, the more effort was needed to convince them that the crisis was real.
Tip #2: Don’t take too long listening to the dissenters; they can absorb time and disrupt your teamwork. Make certain the dissenters’ opinions are heard, reviewed for merit, and then move on. Get the right people on the bus and the wrong people off. Make sure all leaders take ownership in the situation and most importantly, don’t punish each other by playing the blame game. Leaders must not be distracted by looking at what others should be doing, but stay focused on what they and their team should be doing.
Tip #3: Engage the front-line leaders ASAP because they are usually an untapped resource of great ideas and value added initiatives; they should also be engaging their line staff for more untapped great ideas. Your front-line leaders are a great resource if you have a process to elicit their feedback, ideas, and advice. Take advantage of this feedback early on because it will take time for the ideas to gain acceptance and get traction.
Tip #4: If people know the score and keep the score, the score will improve. You cannot underestimate the importance of communication. The more you “overcommunicate” exactly where the organization is and what is at stake, the more likely people are to work together to solve the challenges you face. When all staff know what the leaders know, the adjustments that the organization needs to make are viewed as logical given the undesirable hand you have been dealt.
“We recently brought in a relatively inexpensive but very good motivation speaker to share with them the characteristics of personal and organizational greatness. This was a good uplift and inspirational for many. It recharged some batteries for our leaders.”
Tip #5: Process improvements always, always, ALWAYS takes longer than you expect. As good as you think you are at redesigning the way work is done (process improvements), driving out waste (lean techniques), reducing variations (Six Sigma), and adding real value to patients, there is always another level of performance you haven’t explored yet.
Tip # 6: We had to remind ourselves to get off the treadmill, celebrate the wins and recognize exceptional performance. Take a time-out and recognize the heroic performance that everyone has exhibited. It will become the “rocket fuel” they need for the next level of performance.
Tip #7: CEO Jim Nathan has always repeated his personal philosophy that FTE reductions should be considered a failure in leadership.
Tip #8: Finally, we had to accept that HR could add significant value by raising the bar of performance by every measure. We were initially under the impression that if we fundamentally changed the ratio of HR professionals to total staff (previously 1:140 and now 1:200) that we somehow couldn’t deliver on good internal customer service. Well, we were wrong again. Our team now recognizes that you just never know what’s possible until you test yourself.

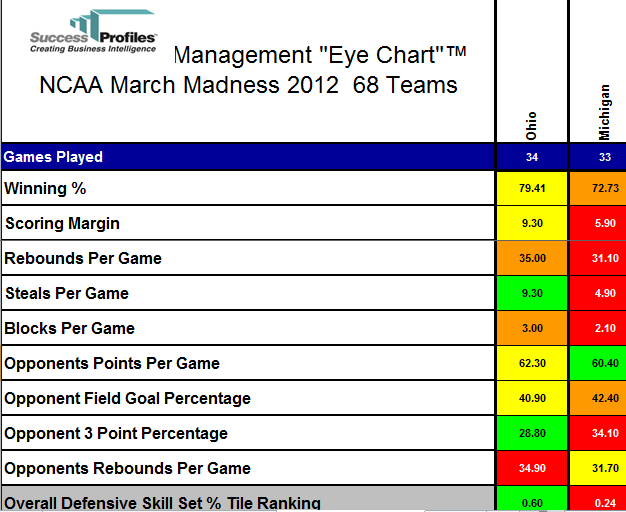 With the first two rounds of the 2012 NCAA Tournament completed, all eyes are on the brackets and the results. After carefully dissecting our way through 22 different categories of statistical information, the Eye Chart picked 23 of the 32 first round game’s correctly for a 72% success rate. In the second round, the eye chart correctly picked 11 out of 16 games correctly for a 69% success rate. By removing the emotional bias, the Eye Chart was able to pick some of the upsets of the first round. For those who would have picked Michigan to beat Ohio because it was a 4 seed versus a 13 seed might not have picked it if they had seen the overall statistical information. If you were to look at the Eye Chart, you would see that Ohio is statistically stronger in over 68% of the major categories raising the upset alert flag.


